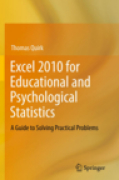
Excel 2010 for educational and psychological statistics: a guide to solving practical problems
Quirk, Thomas
Excel has become an important and nearly ubiquitous classroom and office resource for students and practitioners who are faced with solving statistical problems on an everyday basis. Despite this, there has yet to emerge a truly practical, “how-do-I-do-it” manual that teaches the various applications and processes/formulas for Excel in educational and psychological Statistics. Quirk’s Excel 2010 for Educational and Psychological Statistics will fill this void, as it is designed to be a step-by-step, exercise-driven guide for education andpsychology students who need to master Excel to create formulas and solve statistical problems. Each chapter first explains briefly the formulas that are included in the chapter, and then directs the student on how to use Excel commands and formulas to solve a specific business problem. Three practice problems are provided at the end of each chapter, along with their solutions in an Appendix. At the end of the Excel Guide, an additional Practice Exam allows the reader to test his or her understanding of each chapter by attempting tosolve a specific educational or psychometrical issue or problem using Excel (the solution to this problem is also given in an Appendix). From the beginning of the book, readers/students are taught how to write their own formulas andthen how to utilize Excel drop-down formula menus as well for such exercises involving one-way ANOVA, simple linear regression, and multiple correlation. Contains 163 color screen shots. Very practical. Focuses on the writing and application of specific formulas rather than esoteric statistical theory. Exercise driven and diverse, covering fundamental and advanced statistical processes such as Regression and ANOVA. Includes specific objectives imbedded in the text for each concept, so that students can understand the purpose of all ofthe Excel steps. INDICE: Preface. Acknowledgements. Sample Size, Mean, Standard Deviation, and Standard Error of the Mean. Random Number Generator. Confidence Interval About the Mean Using the TINV Function and Hypothesis Testing. One-Group t-Testfor the Mean. Two-Group t-Test of the Difference of the Means for IndependentGroups. Correlation and Simple Linear Regression. Multiple Correlation and Multiple Regression. One-Way Analysis of Variance (ANOVA). Appendix A: Answers to End-of-Chapter Practice Problems. Appendix B: Practice Test. Appendix C: Answers to Practice Test. Appendix D: Statistical Formulas. Appendix E: t-table. Index.
- ISBN: 978-1-4614-2070-5
- Editorial: Springer New York
- Encuadernacion: Rústica
- Páginas: 238
- Fecha Publicación: 28/01/2012
- Nº Volúmenes: 1
- Idioma: Inglés
- Inicio /
- INFORMÁTICA /
- EXCEL
