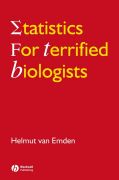
statistical methods and applications accessible to undergraduate biology and environmental science students. INDICE: Preface. 1. How to Use this Book. Introduction. The Text of the Chapters. What Should You Do if You Run into Trouble?. Elephants. The Numerical Examples in the Text. Boxes. Spare-time Activities. Executive Summaries. Why Go to All that Bother?. The Bibliography. 2. Introduction. What are Statistics?. Notation. Notation for Calculating the Mean. 3. Summarizing Variation. Introduction. Different Summaries of Variation. Why n - 1?. Why the Squared Deviations?. The Standard Deviation. The Next Chapter. 4. When are Sums of Squares Not Sums of Squares?. Introduction. Calculating Machines Offer a Quicker Method of Calculating Sums of Squares. Avoid Being Confused by the Term "Sum of Squares". Summary of the Calculator Method of Calculating Down to Standard Deviation . 5. The Normal Distribution. Introduction. Frequency Distributions. The Normal Distribution. What Per Cent is a Standard Deviation Worth?. Are the Percentages Always the Same as These? . Other Similar Scales in Everyday Life. The Standard Deviation as an Estimate of the Frequency of a Number Occurring in a Sample. From Per Cent to Probability. Executive Summary 1 -The Standard Deviation. 6. The Relevance of the Normal Distribution to Biological Data. To Recap. Is Our Observed Distribution Normal?. What Can We Do about a Distribution thatClearly is not Normal?. How Many Samples are Needed?. 7. Further Calculationsfrom the Normal Distribution. Introduction. Is "A" Bigger than "B"?. The Yardstick for Deciding. Derivation of the Standard Error of a Difference Between Two Means. The Importance of the Standard Error of Differences Between Means. Summary of this Chapter. Executive Summary 2 - Standard Error of a Difference Between Two Means. 8. The t-test. Introduction. The Principle of the t-test. The t-test in Statistical Terms. Why t?. Tables of the t-distribution. The Standard t-test. t-test for Means Associated with Unequal Variances. The Paired t-test. Executive Summary 3 - The t-test. 9. One Tail or Two?. Introduction. Why is the Analysis of Variance F-test One-tailed?. The Two-tailed F-test. How Many Tails has the t-test?. The Final Conclusion on Number of Tails. 10. Analysisof Variance - What is it? How Does it work?. Introduction. Sums of Squares inthe Analysis of Variance. Some "Made-up" Variation to Analyze by Anova . The Sum of Squares Table. Using Anova to Sort Out the Variation in Table C. The Relationship Between "t" and "F". Constraints on the Analysis of Variance. Comparison Between Treatment Means in the Analysis of Variance. The Least Significant Difference. A Caveat About Using the LSD. Executive Summary 4 - The Principle of the Analysis of Variance. 11. Experimental Designs for Analysis of Variance. Introduction. Fully Randomized. Randomized Blocks. Incomplete Blocks. Latin Square. Split Plot. Executive Summary 5 - Analysis of a Randomized Block Experiment. 12. Introduction to Factorial Experiments. What is a Factorial Experiment?. Interaction. How Does a Factorial Experiment Change the Form of the Analysis of Variance?. Sums of Squares for Interactions. 13. 2-Factor Factorial Experiments. Introduction. An Example of a 2-Factor Experiment. Analysis of the 2-Factor Experiment. Two Important Things to Remember About Factorials Before Tackling the Next Chapter. Analysis of Factorial Experiments with Unequal Replication. Executive Summary 6 - Analysis of a 2-Factor Randomized Block Experiment. 14. Factorial Experiments with More than Two Factors . Introduction. Different "Orders" of Interaction. Example of a 4-Factor Experiment. Addendum - Additional Working of Sum of Squares Calculations. 15. Factorial Experiments with Split Plots. Introduction. Deriving the Split Plot Design from the Randomized Block Design. Degrees of Freedom in a Split Plot Analysis. Numerical Example of a Split Plot Experiment and its Analysis. Comparison of Split Plot and Randomized Block Experiment. Uses of Split Plot Designs. 16. The t-test in the Analysis of Variance. Introduction. Brief Recap of Relevant Earlier Sections of this Book. Least Significant Difference Test. Multiple Range Tests. Testing Differences Between Means. Presentation of the Results of Tests of DifferencesBetween Means. The Results of the Experiments Analyzed by Analysis of Variance in Chapters 11-15. 17. Linear Regression and Correlation. Introduction. Cause and Effect. Other Traps Waiting for You to Fall Into. Regression . Independent and Dependent Variables. The Regression Coefficient (b). Calculating the Regression Coefficient (b) . The Regression Equation. A Worked Example on Some Real Data. Correlation . Extensions of Regression Analysis. Executive Summary 7- Linear Regression. 18. Chi-square Tests. Introduction. When and Where Not to Use c2. The Problem of Low Frequencies. Yates' Correction for Continuity. The c 2 Test for "Goodness of Fit". Association (or Contingency) c2. 19. Nonparametric Methods (What are They?). Disclaimer. Introduction. Advantages and Disadvantages of the Two Approaches. Some Ways Data are Organized for Nonparametric Tests. The Main Nonparametric Methods that are Available. Appendix. A1 How Many Replicates?. A2 Statistical Tables. A3 Solutions to "Spare-time Activities". A4 Bibliography. Index.
- ISBN: 978-1-4051-4956-3
- Editorial: Blackwell
- Encuadernacion: Rústica
- Páginas: 360
- Fecha Publicación: 01/04/2008
- Nº Volúmenes: 1
- Idioma: Inglés
