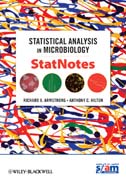
Statistical analysis in microbiology: statnotes
Armstrong, Richard A.
Hilton, Anthony C.
INDICE: Preface. Acknowledgments. Note on Statistical Software. 1 ARE THE DATA NORMALLY DISTRIBUTED? 1.1 Introduction. 1.2 Types of Data and Scores. 1.3 Scenario. 1.4 Data. 1.5 Analysis: Fitting the Normal Distribution. 1.6 Conclusion. 2 DESCRIBING THE NORMAL DISTRIBUTION. 2.1 Introduction. 2.2 Scenario. 2.3Data. 2.4 Analysis: Describing the Normal Distribution. 2.5 Analysis: Is a Single Observation Typical of the Population? 2.6 Analysis: Describing the Variation of Sample Means. 2.7 Analysis: How to Fit Confidence Intervals to a Sample Mean. 2.8 Conclusion. 3 TESTING THE DIFFERENCE BETWEEN TWO GROUPS. 3.1 Introduction. 3.2 Scenario. 3.3 Data. 3.4 Analysis: The Unpaired t Test. 3.5 One-Tail and Two-Tail Tests. 3.6 Analysis: The Paired t Test. 3.7 Unpaired versus the Paired Design. 3.8 Conclusion. 4 WHAT IF THE DATA ARE NOT NORMALLY DISTRIBUTED? 4.1 Introduction. 4.2 How to Recognize a Normal Distribution. 4.3 Nonnormal Distributions. 4.4 Data Transformation. 4.5 Scenario. 4.6 Data. 4.7 Analysis: MannWhitney U test (for Unpaired Data). 4.8 Analysis: Wilcoxon Signed-Rank Test (for Paired Data). 4.9 Comparison of Parametric and Nonparametric Tests. 4.10 Conclusion. 5 CHI-SQUARE CONTINGENCY TABLES. 5.1 Introduction. 5.2 Scenario. 5.3 Data. 5.4 Analysis: 2 x 2 Contingency Table. 5.5 Analysis: Fisher's 2 x2 Exact Test. 5.6 Analysis: Rows x Columns (R x C) Contingency Tables. 5.7 Conclusion. 6 ONE-WAY ANALYSIS OF VARIANCE (ANOVA). 6.1 Introduction. 6.2 Scenario. 6.3 Data. 6.4 Analysis. 6.5 Assumptions of ANOVA. 6.6 Conclusion. 7 POST HOC TESTS. 7.1 Introduction. 7.2 Scenario. 7.3 Data. 7.4 Analysis: Planned Comparisons between the Means. 7.5 Analysis: Post Hoc Tests. 7.6 Conclusion. 8 IS ONE SET OF DATA MORE VARIABLE THAN ANOTHER? 8.1 Introduction. 8.2 Scenario. 8.3 Data. 8.4 Analysis of Two Groups: Variance Ratio Test. 8.5 Analysis of Threeor More Groups: Bartlett's Test. 8.6 Analysis of Three or More Groups: Levene's Test. 8.7 Analysis of Three or More Groups: BrownForsythe Test. 8.8 Conclusion. 9 STATISTICAL POWER AND SAMPLE SIZE. 9.1 Introduction. 9.2 Calculate Sample Size for Comparing Two Independent Treatments. 9.3 Implications of Sample Size Calculations. 9.4 Calculation of the Power (P) of a Test. 9.5 Power and Sample Size in Other Designs. 9.6 Power and Sample Size in ANOVA. 9.7 More Complex Experimental Designs. 9.8 Simple Rule of Thumb. 9.9 Conclusion. 10 ONE-WAY ANALYSIS OF VARIANCE (RANDOM EFFECTS MODEL): THE NESTED OR HIERARCHICAL DESIGN. 10.1 Introduction. 10.2 Scenario. 10.3 Data. 10.4 Analysis. 10.5 DistinguishRandom- and Fixed-Effect Factors. 10.6 Conclusion. 11 TWO-WAY ANALYSIS OF VARIANCE. 11.1 Introduction. 11.2 Scenario. 11.3 Data. 11.4 Analysis. 11.5 Conclusion. 12 TWO-FACTOR ANALYSIS OF VARIANCE. 12.1 Introduction. 12.2 Scenario. 12.3 Data.
- ISBN: 978-0-470-55930-7
- Editorial: John Wiley & Sons
- Encuadernacion: Rústica
- Páginas: 170
- Fecha Publicación: 30/12/2010
- Nº Volúmenes: 1
- Idioma: Inglés
